Commodities

Behind Every Gallon of Gasoline, Smartphone, and Morning Cup of Coffee Lies a Global Story of Supply, Demand, and Speculation. Dive Into the Dynamic World of Commodities, where Nature, Economics, and Human Decisions Collide.
Industry Sectors Precious Metals Livestock And Meat Textiles Gold Rio Tinto Silver London Metal Exchange Energy Metals Rare Earths Grains Food And Fibre Natural Gas Glencore Newmont Copper Industrial Metals Futures Exchanges Mining
Gas Prices Capped at $3 as LNG Logistics Strain Supply Chains
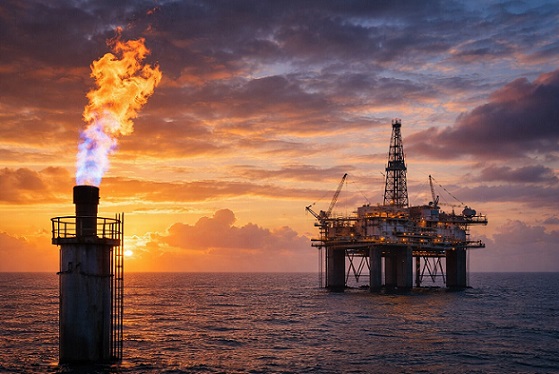
Natural gas remains below the $3 mark, as tightening logistics in the liquefied natural gas (LNG) sector offset broader supply availability.
While the global gas system still has ample volumes across regions, operational flexibility is eroding.
Cargoes are taking longer routes, schedules are becoming tighter, and execution risks are growing, shifting the market’s focus from how much gas is available to how efficiently it can move.
Although benchmarks and storage levels still point to stability, the underlying market structure is growing more demanding. Gas markets have entered a phase where visible calm masks rising pressure on the delivery side.
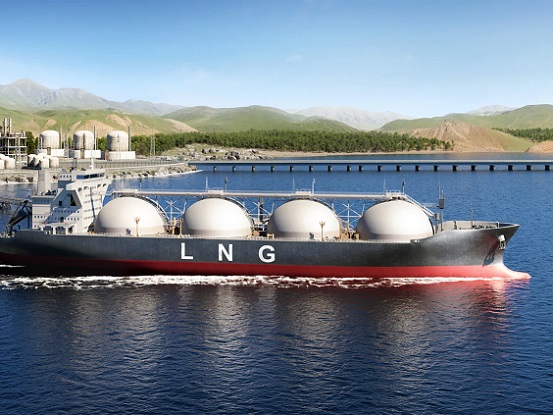
LNG volumes are still moving, with supply available across all regions. The main challenge now lies in mobility within the system, which increasingly determines how efficiently gas can reach final markets.
This shift shows up in changing flow patterns. Disruptions at key export terminals, combined with pressure along major shipping routes, are forcing longer detours and funneling traffic into fewer dependable corridors. Execution has become more demanding, and timing now plays a decisive role in keeping the system balanced.
Tightness in the market is not about a lack of supply, it arises from logistics, routing bottlenecks, and heightened sensitivity to schedules. While supply remains adequate, maintaining that balance depends on longer journeys, greater exposure to freight costs, and a rising reliance on precise, well-timed execution.
LNG Trade Flows are Becoming History-dependent.
The role of LNG has traditionally been to balance the global gas system, with cargoes naturally flowing toward the highest-value markets and smoothing out regional mismatches. That core function remains intact, but it now operates within tighter constraints.
Competition for cargoes has intensified. Diverting shipments demands longer planning horizons, steeper freight expenses, and greater vulnerability to corridor-specific risks. With fewer flexible options available on short notice, each individual cargo carries more systemic weight.
The system is gradually shifting toward a path-dependent structure. Supply can still reach end markets, but only through a shrinking set of viable routes, constrained by logistical frictions and strategic manoeuvring.
This shift is visible in market behaviour. While flows continue actively, adjustments are increasingly made through timing and precise execution rather than broad optionality. Route dependency is becoming a hallmark of how the system now operates.
Central to this adjustment is the role of U.S. LNG, which continues to serve as the marginal balancing supply for both Europe and Asia, absorbing fluctuations in demand and offsetting disruptions elsewhere. It performs this function in an environment where liquefaction capacity and logistical flexibility are already under significant strain.
Price Tags Capture a Fraction of the Strain.
Benchmark gas prices are currently responding to headlines, market positioning, and broader energy trends, but they only reflect a portion of the underlying structural shift. Despite rising tensions in physical flows, price action has remained relatively contained. Meanwhile, LNG-linked equities and shipping proxies are showing a more uneven response.
A clearer signal is emerging from the physical layer. Freight rates, routing decisions, and cargo concentration all point to a system that demands tighter coordination to stay in balance. The disconnect between these physical indicators and spot pricing suggests a market still adapting to a fundamentally new regime.
This dynamic unfolds over time. Pricing tends to react only when stress becomes visible, while logistical pressure accumulates internally through mounting inefficiencies and delayed adjustments.
How Technical Structure Mirrors Compression.
The chart reflects the broader environment of structural tightening. The 3.00 level serves as the pivot for the current regime. As long as price holds below it, the structure remains softer, with any upside attempts failing to extend. A sustained move back above 3.00 would signal re-acceptance and a shift in regime.
The rejection near 3.12 defines the failed recovery zone. This level marks where the market tried to rebuild structure but lost momentum, establishing a clear supply reference.
Above that, the 3.25–3.27 zone continues to act as the upper boundary of the broader range. For a transition to a stronger structure, acceptance in that area would be required.
At present, price is compressing between 2.90 and 2.95 while staying above 2.87. This range reflects pressure building within a weakened structure. The sequence of lower highs persists, limiting any recovery and keeping the market contained.
Internal dynamics reinforce this outlook. ECRO remains elevated in the high 50s while delta stays negative, indicating stored energy without directional expansion. This configuration typically resolves with a directional release once compression reaches its limit.
The technical picture mirrors the physical one: pressure is building inside a system that has not yet transitioned into a full directional move.
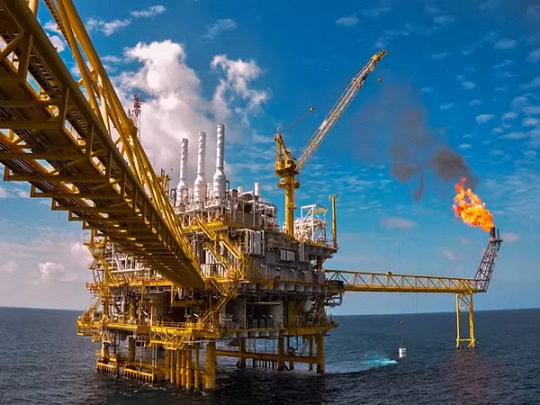
Europe and Asia respond to tightening through distinct structural adjustments.
Regional dynamics illustrate how this pressure spreads across markets.
Europe remains heavily reliant on consistent LNG imports to preserve storage levels and meet seasonal demand. As procurement grows more competitive, maintaining supply balance now depends on tighter scheduling, greater sensitivity to freight costs, and a much smaller margin for disruption.
In Asia, demand patterns are more varied. Taiwan, for instance, has pivoted its procurement toward US and Australian supplies after disruptions to Qatari flows, ensuring continuity while deepening its dependence on stable sea routes. Natural gas continues to play a key role in the region’s power generation.
South Korea benefits from a more diverse energy mix, including nuclear and coal, which adds a layer of resilience. Its exposure to individual LNG sources is relatively balanced, though it still operates within a system where timing and routing constraints are increasingly consequential.
These regional differences influence how tightening market conditions are absorbed, affecting procurement strategies and cost structures across the board.
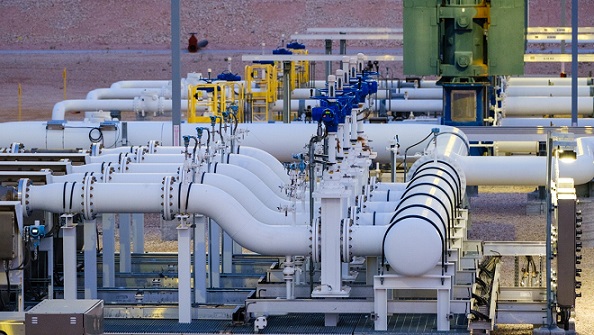
Helium as a Conduit for Industrial Spillovers.
Tighter helium flows don't just disrupt gas markets, they ripple through industrial supply chains.
Helium, produced as a byproduct of natural gas processing, is essential to semiconductor manufacturing. Because it moves through the same supply chains as liquefied natural gas (LNG), any shifts in gas processing or LNG flows directly affect helium availability.
At the industrial level, this dependency becomes clear. Semiconductor fabrication depends on a stable helium supply for cooling and controlled environments. When helium availability grows less predictable, manufacturers respond by incurring higher costs, tightening inventory controls, and facing greater operational complexity.
In response, Taiwan and South Korea have built resilience through stockpiling, recycling programs, and diversifying their helium sources. These measures help stabilize production, though they raise the cost of maintaining reliable supply.
Ultimately, what begins as a constraint in energy logistics works its way into industrial cost structures and gradually ripples through broader supply chains.
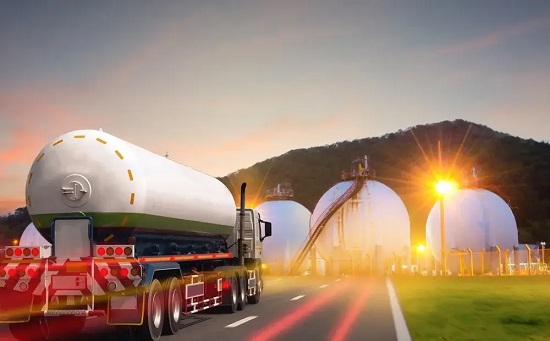
Final Take
The global gas market still has supply, but the framework that enables that supply is growing tighter. LNG continues to move between regions, guided by a system defined by routing dependencies, stricter execution, and an increasing sensitivity to timing. The clearest signs of this shift can be seen in cargo flows, freight dynamics, and where supply is concentrated.
The system only holds together through constant adjustment. Each adjustment brings added cost, longer routes, and greater exposure to disruption. Energy security is being preserved, but through a more complex architecture, and that complexity has become the price of balance.
Supply is still circulating, but now along longer paths, with tighter schedules and rising logistical friction. Value is no longer just in the gas itself; it is increasingly found in how that gas is transported, timed, and delivered.

Record Oil Hedging Surge as Venezuela’s Return Shakes Up Global Crude Flows
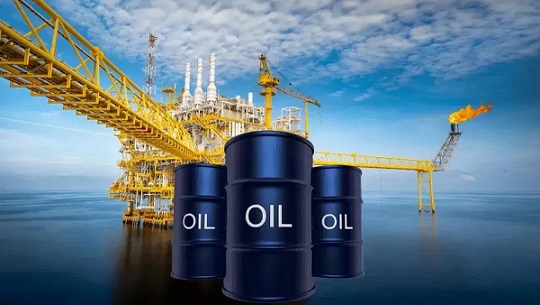
CALGARY, Canada & HOUSTON – Intercontinental Exchange (NYSE:ICE) reported record participation in January 2026 across its Midland WTI (HOU) and Canadian crude oil markets, as traders and producers moved to hedge against shifting trade flows driven by Venezuela’s reemergence as a major oil exporter.
According to Jeff Barbuto, SVP of Global Oil Markets at ICE, the return of Venezuelan crude is intensifying competition for Canadian oil along the U.S. Gulf Coast and in key export destinations such as China. At the same time, growing volumes of discounted Russian crude are adding further pressure, with Chinese demand stepping in to absorb barrels as Indian demand declines amid sanctions on Moscow.
Barbuto continued, noting that severe U.S. winter weather has further disrupted production and refining dynamics, compounding the impact of geopolitical tensions with Iran, which have added risk premiums to the oil market. These complex global dynamics have intensified competition for Canadian crude from multiple sources, driving record trading in January through ICE's Midland WTI (HOU) and Western Canadian futures markets.
In January 2026, several crude benchmarks reached new volume records. ICE Midland WTI (HOU), the key benchmark for pricing U.S. crude production and exports, saw 1.9 million contracts trade over the course of the month, alongside a record average daily volume of 96,388 contracts. The contract also set consecutive single-day volume records, peaking at 257,569 contracts traded on January 30.
ICE Western Canadian Select (WCS) 1a Index futures (TMW), the benchmark for Canadian heavy crude, posted a record 130,000 contracts for the month with an average daily volume of 6,200 contracts. It also achieved a new single-day volume record of 19,965 lots on January 6. Meanwhile, ICE WCS Houston futures (ARV), which prices against physical WCS transactions reported in Houston, recorded 188,000 contracts traded and a record average daily volume of 8,970. TMW serves as the benchmark price for Western Canadian Select crude at the oil sands in Canada, while ARV is the benchmark for WCS traded in Houston.
Traders and clearing members can benefit from margin offsets as high as 98% when using ICE, with offsets available across more than 800 oil contracts, including ICE Brent, Gasoil, WTI (Cushing), Dubai (Platts), Murban, as well as NY Harbor RBOB Gasoline and Heating Oil. Oil clearing now operates under ICE’s new Value-At-Risk margin model, IRM 2, which provides greater precision for well-hedged portfolios.
ICE remains the home of the world’s most liquid energy markets for managing risk exposure. In 2025, a record 1.2 billion energy derivatives contracts traded on ICE, including 736 million oil futures and options.
About Intercontinental Exchange
Intercontinental Exchange, Inc. (NYSE: ICE) is a Fortune 500 company that builds and operates digital networks to connect people to opportunity. As a leader in financial technology and data services, we deliver mission-critical workflow tools that enhance transparency and efficiency across major asset classes. Our operations span the world’s leading exchanges, including the New York Stock Exchange, along with clearing houses, fixed income platforms, and data services. Through ICE Mortgage Technology, we are modernizing the U.S. housing finance lifecycle, from consumer engagement to servicing. Ultimately, ICE transforms industries by streamlining and automating complex processes to unlock opportunity for our customers.
Trademarks of ICE and its affiliates include Intercontinental Exchange, ICE, the ICE block design, NYSE, and New York Stock Exchange. Additional trademark and intellectual property information for Intercontinental Exchange, Inc. and/or its affiliates is available here. Key Information Documents for products covered by the EU Packaged Retail and Insurance-based Investment Products Regulation can be found on the relevant exchange’s website under the heading “Key Information Documents (KIDS).”
Safe Harbor Statement under the Private Securities Litigation Reform Act of 1995: Statements in this press release that are not historical facts are forward-looking statements that involve risks and uncertainties. For more information on risks and uncertainties that could cause actual results to differ from those expressed in these forward-looking statements, please refer to ICE’s filings with the Securities and Exchange Commission (SEC), including the risk factors outlined in its Annual Report on Form 10-K for the year ended December 31, 2025, filed with the SEC on February 5, 2026.
The Essential Guide to Commodities: Trading, History, and Market Mechanics
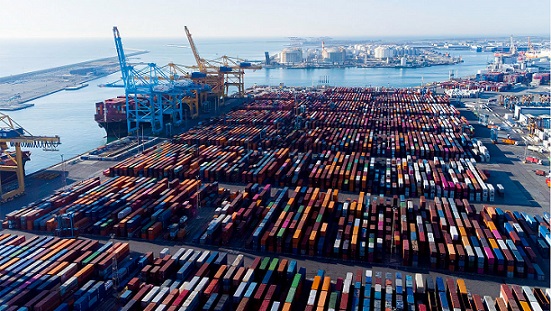
Commodities: A Definition
Commodities are raw materials or primary agricultural products that are fundamentally interchangeable, meaning each unit is virtually identical regardless of the producer.
They are traded based solely on price, not on brand, quality, or features. This tradability is made possible by standardized contracts and grading systems that define the underlying asset, ensuring uniformity across the market.
Commodities are foundational inputs for producing other goods and services and play a key role in global markets and economies.
A Brief History of Commodities Trading
The modern commodities market has its roots in 1840s Chicago. Farmers would bring their wheat to a central market to sell for cash. This evolved into the forward contract, where a farmer and dealer would agree on a future delivery of a set quantity at a fixed price, providing certainty for both.
This system quickly grew more sophisticated. Contracts became transferable; a farmer could pass his obligation to another, or a dealer could sell his contract to a different buyer. This introduced the dynamic of supply and demand into pricing, poor harvests drove prices up, while surpluses drove them down.
Soon, speculators entered the market, trading the contracts themselves to profit from price movements rather than seeking physical delivery of the goods.

Characteristics of a Tradable Commodity
For a product to be successfully traded as a commodity, it typically must meet several criteria:
Standardization: It must be uniform and meet specified grade standards (e.g., "No. 2 Hard Red Winter Wheat").
Durability/Shelf-Life: Particularly for agricultural commodities, the product must be storable without spoiling.
Price Volatility: There must be sufficient fluctuation in supply, demand, and consequently price. This inherent risk is what creates the opportunity for profit.
Common examples include energy (crude oil, electricity), metals (gold, copper), agricultural goods (wheat, pork bellies), and even financial instruments like currencies.
Commodities vs. Stocks: A Key Distinction
From a trading perspective, a primary difference lies in the holding period and intent. Stocks are often bought as long-term investments in a company's growth. Commodities futures contracts, however, are typically held for shorter periods. They are primarily used to hedge against price risks (e.g., an airline locking in fuel costs) or to speculate on price directions, without ever taking physical possession of the good.
How Commodities are Traded Today
Trading occurs on regulated exchanges such as the Chicago Board of Trade (CBOT), the New York Mercantile Exchange (NYMEX), and the London Metal Exchange (LME). Trading happens in designated pits for specific contracts or, increasingly, via electronic systems. Only exchange members can trade directly on the floor, while most investors and traders participate through brokerage firms that are members.
Common Categories of Commodities:
1. Energy
- Crude oil
- Natural gas
- Heating oil
- Gasoline
- Coal
2. Metals
- Precious metals: Gold, silver, platinum, palladium
- Industrial metals: Copper, aluminum, nickel, zinc
3. Agricultural Products
- Grains: Wheat, corn, soybeans, rice
- Softs: Coffee, cocoa, sugar, cotton
- Livestock: Live cattle, feeder cattle, lean hogs
4. Other
- Lumber
- Rubber
- Certain fertilizers
Key Features:
- Fungibility: One unit is essentially the same as another (e.g., a barrel of crude oil from Saudi Arabia is treated the same as one from the U.S. in standardized markets).
- Traded on Exchanges: Commodities are often traded on regulated exchanges like the Chicago Mercantile Exchange (CME) or the New York Mercantile Exchange (NYMEX).
- Price Volatility: Commodity prices can fluctuate widely due to supply/demand imbalances, geopolitical events, weather, and macroeconomic trends.
Ways to Invest:
- Futures contracts: Agreements to buy/sell a commodity at a future date at a set price.
- Commodity ETFs: Exchange-traded funds that track commodity indices or specific sectors.
- Physical ownership: Rare for individuals (e.g., buying gold bullion).
- Stocks of commodity producers: Investing in companies that extract or produce commodities.
Conclusion
Commodity futures and options trading is a complex and high-risk arena that is not suitable for all investors. It requires specialized knowledge, careful strategy, and disciplined risk management. If you are considering it, you must clearly define your risk tolerance and investment objectives. While the potential for significant reward exists, it is equally important to acknowledge the potential for substantial loss. Success hinges on sound judgment, continuous education, and effective risk control.

Tweet